This post describes some of the ways to apply the COT charts that are regularly posted on SwordandShieldforex.com
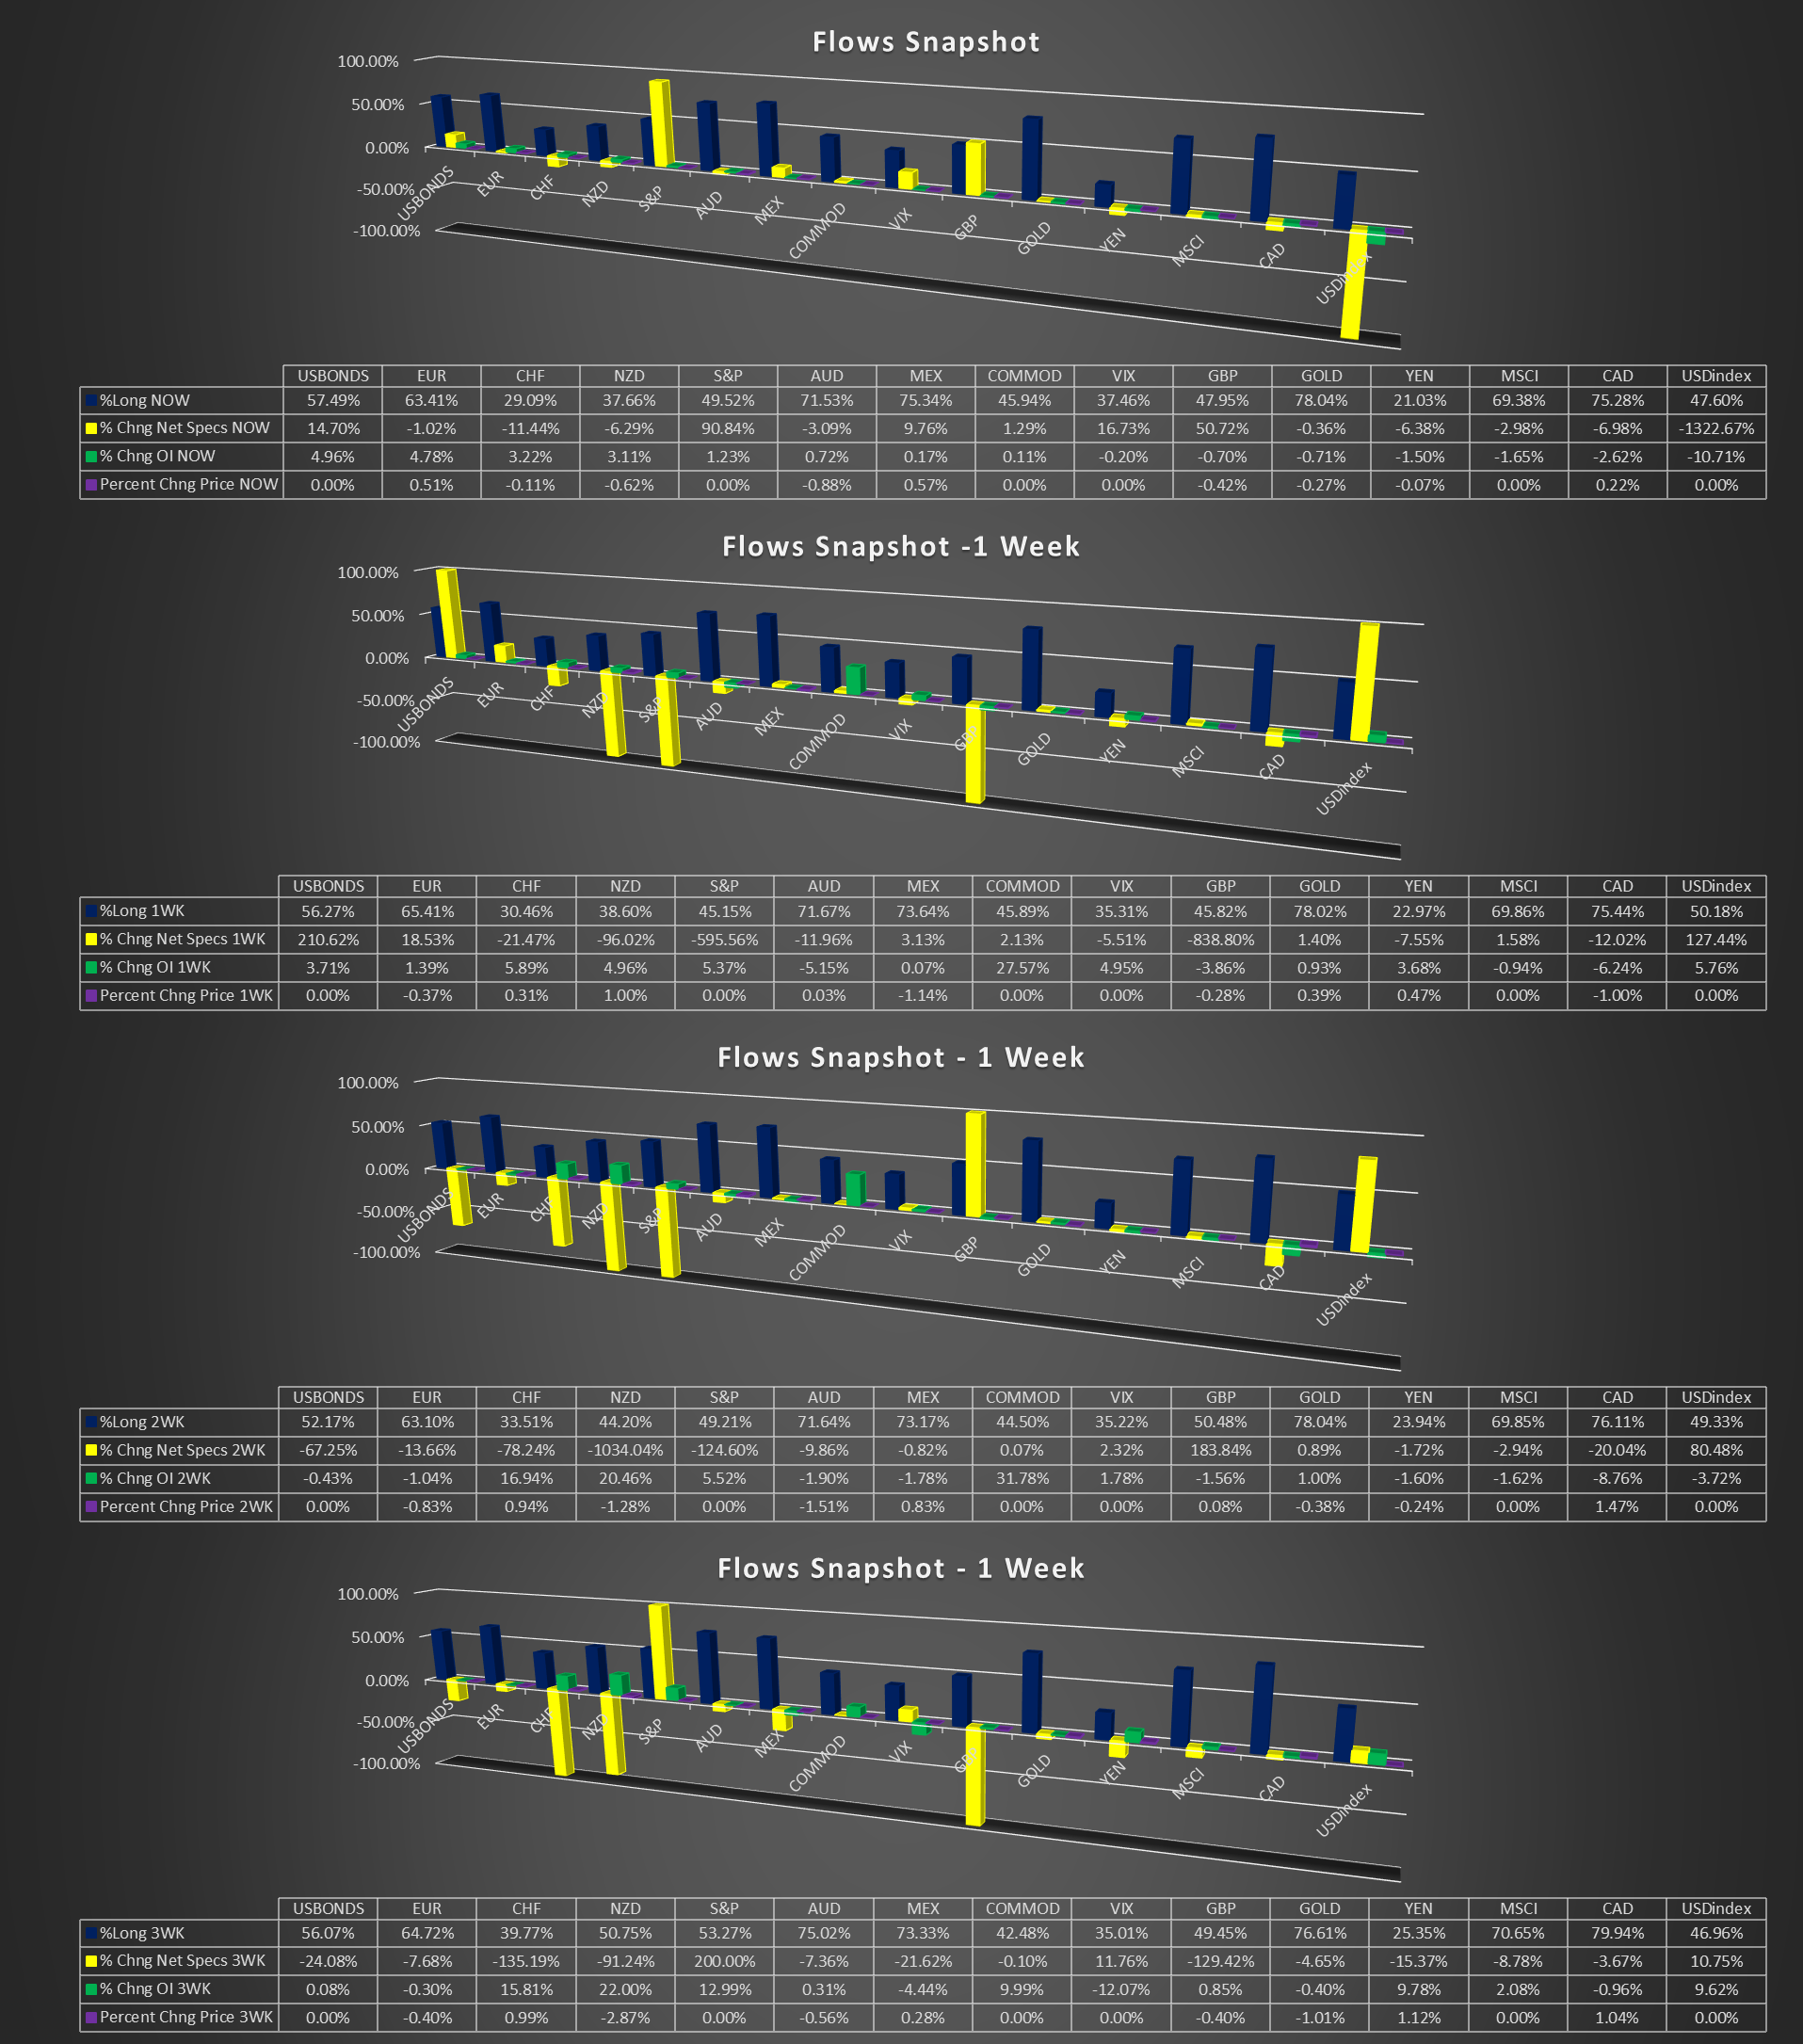
Flows Snaphot – Arranged by Percent Long

Description.
This chart includes speculator data for the previous 4 weeks and includes.
Percent Long (Net Position, Longs-Short)
Percent Change Net Specs (percent change of speculators net postion from previous week)
Percent Change OI (Percent change of total Open Interest from previous week)
Percent Change Price (change in price from previous week).
The following currencies are included:
Currencies: AUD, GBP, CAD, EUR, JPY, MEX, CHF, JPY.
Other Markets: S&P 500 Stock Index, Gold, US Treasury Bonds, VIX, MSCI Emerging Markets Mini Index, Bloomberg Commodity Index, USD Index
General Analysis
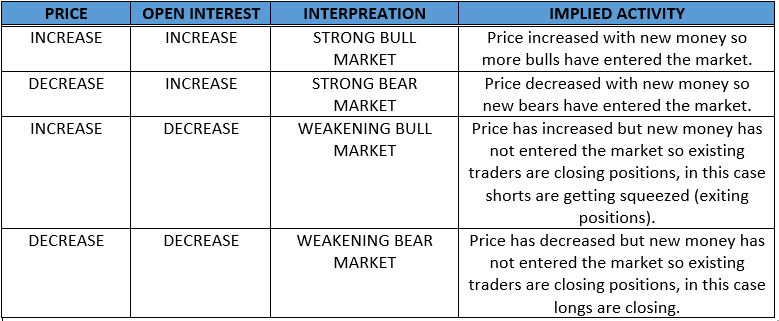
Data points presented are to give an overall market snapshot and to visually identify and track changes in the asset over the past four weeks using standard OI rules:

Analysis Applications
- Quickly identify which assets and currencies are bullish, bearish, or neutral.
- Visually Identify Flows and Intermarket Relationships via large changes in OI or speculator positioning
- Compare current data to previous weeks data to determine conviction of trends
- Identify Potential Trades by Pairing Strong vs Weak
- Devise Currency Baskets Based on Strong/Weak Pairs
- Identify potential consensus trades which may be ripe for reversal
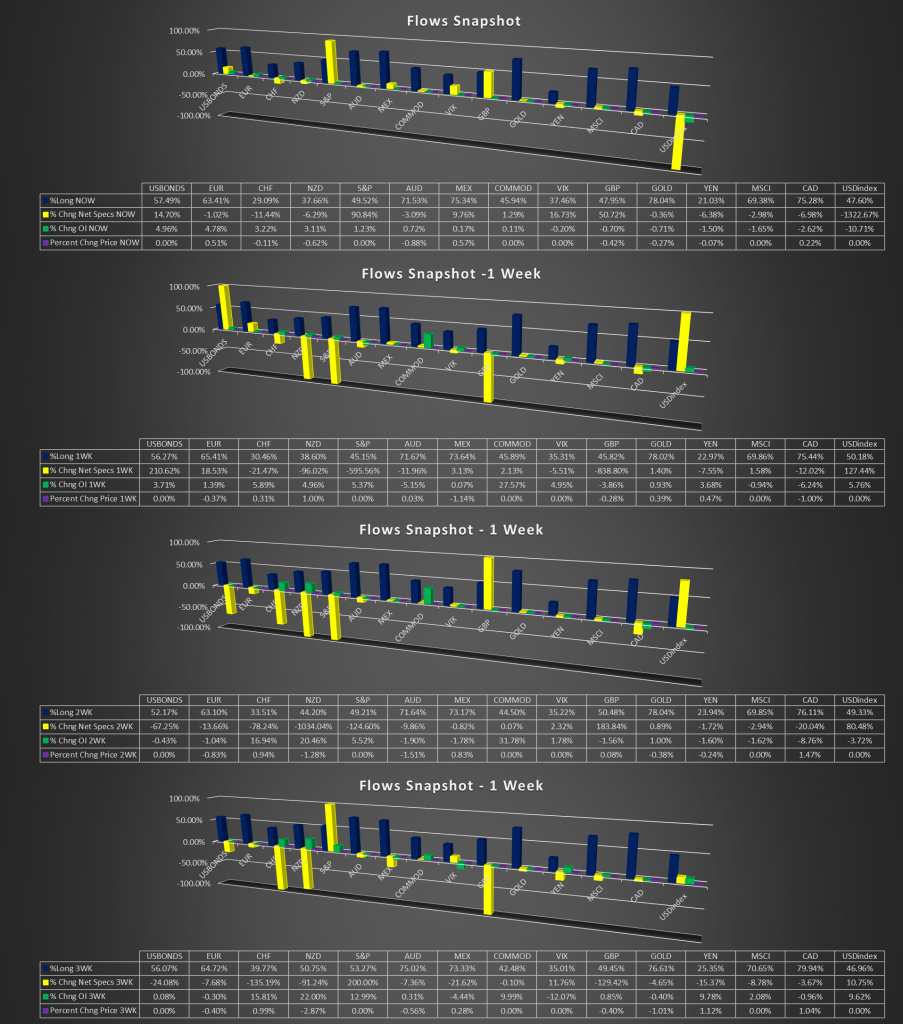
Flows Snapshot – Arranged by Open Interest

Description:
This chart is the same as the previous chart but is organized via changes in Open Interest. Asset with largest change in OI appears on the left end of the axis. Asset with the lowest change in OI is on the right.
Analysis Application
- Easily identify which markets have received the most interest/money and track the progression over the last 4 weeks
- Use as sentiment index to cross reference with news event or major technical turning points.
- Identify Markets with potentially increased volatility for trading opportunities.
Dashboard Table – All Assets
Description
This table includes all the data included in the Flows Snapshot charts but also includes: the Percent Change of Commerical Traders; the Percent Change of each group; as well as 14 period Standard Deviation warning lights for Open Interest and the spread between speculator and commercial traders (Net Spec – Net Comm).
Analysis Applications
- Visually detect potential trading opportunities, confirm and follow existing trends and detect potential exhaustion points.
- Identify level of conviction of overall changes in positioning by detecting harmony among commercial and speculator changes in positioning
- Identify causes in trend pullbacks (squeezes vs profit taking) and by which group (spec vs comm)
- Use “Percent Change” by group to detect changes in market outlook by group.
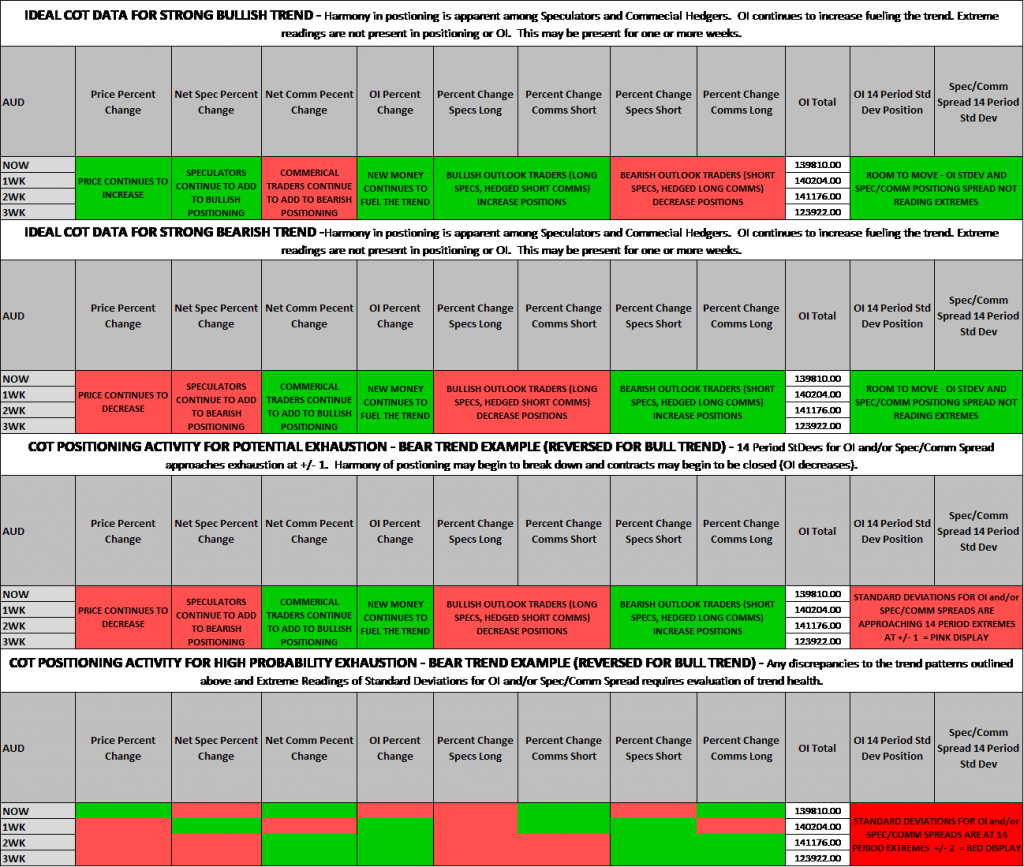
Examples of color patterns (positioning behavior) that signifies strong trends and potential exhaustion are provided in the following image.


