
This post will give a brief overview of the Commitment of Traders data provided by the CFTC and how it can be applied to enhance your trading.
Why is Commitment of Traders Data Needed?
The forex market is an over-the-counter market so brokers and dealers negotiate directly with one another because there is no central exchange or clearing house. Without a central exchange, keeping track of Futures data provides an excellent opportunity to track flows and if you haven’t done so already, I strongly recommend incorporating it into your trading repertoire especially if you are a swing or position trader.
The report can be found at www.cftc.gov and it provides a breakdown of each Tuesday’s open interest for markets in which 20 or more traders hold positions equal to or above the reporting levels established by the CFTC.
Understanding the Players
The COT includes data for both Futures and Options positions held by commercial, non-commercial and non-reportable positions. It’s important to understand these players.
Non-commercial traders are large speculators; Hedge funds for example. So speculators place trades with the direction of the anticipated price.
Commercial traders, by definition when reporting to the CFTC, are taking futures positions for the purpose of hedging. They are not looking to profit from speculating about the directional change in prices but rather are engaged in the market to lock in prices to hedge out risks of their business operations. Thus commercial traders place trades in the opposite direction of anticipated price. Note, sometimes commercial traders of non-commodity futures are referred to as dealers.
Finally there are Non-reportable classified traders which are smaller speculators. Some use non-reportable traders as a contrarian indicator, that is taking trades in the opposite direction of these players.
This chart shows the NET POSITION of speculators and commercial traders. The Net position is the difference between those holding long contracts to those holding short contracts.
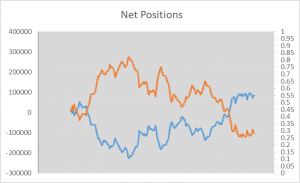
So if it is negative they are NET SHORT; there are more traders holding short contracts than long contracts and therefore the group has an overall bearish outlook. And if the net position is positive they are NET LONG; they are holding more long contracts than short and have a bullish outlook.
The inverse relationship of these 2 groups illustrated in this chart confirms that speculators and commercial traders take opposite positions.
Which Group to Watch?
There are different theories on which group is better to monitor but from looking at the NET POSITION CHART above you can clearly see that the speculators and commercial traders positions mirror each other. The net spec positions follow price whereas commercial positions are clearly hedged. So hypothetically you could monitor either group for your analysis. I focus on speculators positioning as our interests are aligned opposed to commercial traders since the complexities of their operations could possibly confound their reported intentions of hedging only; however, the most reliable signals would be when there is positional harmony between all players – more on this later.
So how can we use this data?
There are generally two typical approaches to applying COT data. The first is to attempt to follow the positioning of these larger groups – follow the money. The second is determine whether the market is at extremes – is it a consensus trade and may reverse? However, as you will see applying this data can be an exceptionally powerful tool with many applications.
Open Interest – the Forex Market’s Volume Indicator
Open interest is a simple yet sometimes misunderstood concept. It is a very powerful tool though and it is important to understand how it can be applied to improve your trading. Open Interest is the total number of contracts entered into, but have not yet been offset by a transaction.
What does that mean? Well, futures contracts are exactly that, a contract that is to be settled in the future. Two parties get together and agree to make a transaction in the future at a price agreed upon today. When they do this they create a contract out of thin air, and Open Interest increases by “1”.
So this implies a couple important things to understand about Open Interest. First, for every contract there is both a buyer and seller. So open interest has no direction whatsoever. In other words, an increase in open interest does not mean price is increasing or a decrease in open interest does not mean price is decreasing.
Ok. Bear with me, I know this is a little dry but you’ll see the power of all this shortly.
A second important characteristic of open interest is to understand how it changes. I mentioned that with the creation of a new futures contract, open interest will increase by 1. Similarly, the closing of one contract will decrease open interest by 1 as well. So the creation or closing of futures contracts changes open interest.
Yet, often overlooked is that contracts can change hands and open interest will not change. So just because Open Interest has not changed does not mean that the players outlook on the market hasn’t changed. Hypothetically, a large number of speculators holding long contracts could be acquired by new commercial buyers. You would not detect this “new interest” in the market because new contracts weren’t created, but what is just as important is that existing contracts were acquired by parties with different market outlooks. In this case speculators holding contracts with the expectation of price increasing sold to commercial buyers who now hold these long contracts as they expect price to fall. Open interest has not changed but the players expectations on what price will do has. This is a subtle but important distinction to be aware of.
Trend Trading and Exhaustion Points
You’ll find the logic presented in this table is pretty common. It is based on Open Interest data being a gauge of, well, interest. If OI is increasing, there is money flowing into that asset because new contracts are being created – of course we know that these new contracts have both sellers and buyers – so again, OI has no direction. Yet it is an indication of interest in that market. This chart outlines how OI is most often used as a tool to detect the health of trends.
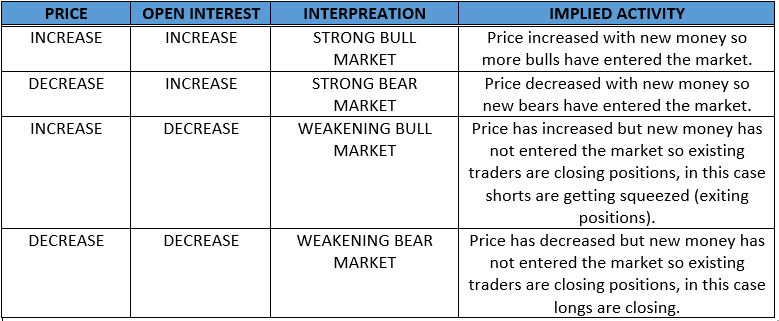
If price is increasing and so is open interest, it suggests that price movement is being fueled by new contracts (or interest) and that it is a bullish signal indicating a healthy trend. Similarly if price is decreasing and open interest is rising, again, this move is fueled by new contracts and it is a bearish signal. You have a healthy downtrend.
On the other hand, if you see price moving up yet open interest is decreasing, the logic is that this move is not fueled by new money and it is sign of a weak move with little conviction behind it. It can also indicate that the move is a result of short or long covering – traders closing their positions opposed to adding on – a squeeze or profit taking.
Now, although the logic in this chart holds true in many cases, there are some important caveats. For example, even if there is indication of a healthy uptrend, price increasing with new interest (increasing OI), we still need to gauge if the market is approaching exhaustion – especially since the COT data lags by a week. This can be achieved by many different methods but the general principle is to compare the current data to a “look-back” period of some sort. For example, you could use the standard deviation for a certain period of time looking at both the OI and the Net Positioning of traders. These measures can give you an idea if there is room to move or suggest whether it has become a consensus trade. Is there any interest/money left to fuel the trend or is time begin locking some profits or looking for signs of reversals.
Secondly, because we know that contracts can change hands between players with different market outlooks without necessarily changing the overall open interest reading (because new contracts aren’t being created), without looking closely at the changes in holdings by specific groups, all changes in OI should be suspect. An ideal signal to confirm a move will have harmony in the positioning of all players.
Because we know commercial and speculator traders take trades in opposing directions we can look for harmony in their positioning. Long speculators and short commercial traders should position in unison as should short speculators and long commercial traders. In the chart below you can see that the net positions for both Speculators holding long contracts, and commercials holding short contracts decreased (both bearish outlook). For the same period, Speculators holding short contracts and Commercials holding long contracts increased (both bearish outlooks).
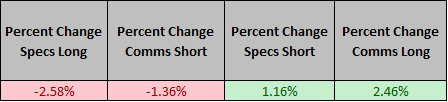
This is an very simple and powerful method of determining whether all groups are sharing the same outlook on price. When they act in harmony, the probability that price moves with them is quite high. They all share the same market sentiment. Moreover, when their positioning is not in harmony, it can be an early indication of a change in trend or simply confusion in the market.
If we take all this information together, we can get a great understanding of how large players are positioning in the markets, whether price movements are fueled by conviction or rather by a squeeze or profit taking, and whether there is room for a trend to continue or if it is running out of steam. So COT data can be used to follow trends or as an indication of when to take some or all profits.
It’s also gives helpful direction for determining which cross to trade. For example, you could pair an asset that is increasingly bullish that has lots of room to move, with one that is increasingly bearish, also with lots of room to move. Or short a pair with an asset that is exceptionally stretched long with hints of changing sentiment from the larger players positioning with one that is similarly stretched to the downside.
Other ways to apply COT data
Clearly a great application of using COT data is to assist with trend following and identifying potential turning points but there are numerous other methods of applying Commitment of Traders data.
For example:
- Use COT data to construct currency baskets. For example, traders may hold bullish outlooks for some currencies but not others vs the USD. Thus a USD basket can be created based on large speculators and commercial traders positioning and rebalanced as their positioning changes. Changes in net positioning can be used as a proxy for allocation/lot sizes.
- Intermarket Analysis. Futures data is available for a number of markets so it is easy to observe positioning across several markets at once to gauge overall market sentiment and trends.
- Risk on Risk off – Determine if interest is increasing in risk assets or risk currencies.
- Breakout strategies/Options Barriers. Look for increasing OI during consolidation to gauge strength of breakout and near Options Barriers for probability of penetration.
- Determine what crosses to trade. Pair strong vs weak currencies to increase the probability of a successful trade. An overbought currency could be paired with an oversold currency for higher probability reversals (careful!)
- General Confirmation of Technical Patterns. Don’t pull the trigger without knowing larger traders are on the same side of the trade as you.
- Theme/Sentiment Analysis – cross reference major data releases or news with changes in positioning to gauge the relevance of that information to major market participants.
Where to from here?
Related Knowledge
Asymmetric Information: You may want to check out our Complete Guide to How the Forex Market Works Whiteboard Explainer Video as we dig deep into Forex Market Structure and Asymmetric Information, order flow on the interdealer market and other topics that will increase your understanding of how a COT strategy can be a critical component of successful market approaches and strategies.
Charts and Resources
There are many resources available online. Some interactive charts are a good place to start by scrolling through price and positioning data to get a feel for the relationship.
Oanda provides a free COT chart which includes speculator positioning and Open Interest.
Timingcharts also provides a useful chart as both speculators and commercial players can be tracked and indicators can be overlayed on the price.
Most of these free charts are quite limited in their functionality to allow for an in depth analysis like that presented in this article. We often post our own COT charts and analysis on this website and on twitter. Follow us and enter your details in the sidebar to keep plugged in!
